Runtime Comparisons

Open In Colab

Runtime Comparisons#

import time

! pip install pywavelet -q
Hide code cell source
import numpy as np
import jax.numpy as jnp
import pandas as pd
import jax
import json
import os

from pywavelet.backend import cuda_available
from tqdm.auto import tqdm
from pywavelet.types import FrequencySeries
from pywavelet.transforms.phi_computer import phitilde_vec_norm
from timeit import repeat as timing_repeat
import matplotlib.pyplot as plt
from typing import Tuple
import glob

jax.config.update("jax_enable_x64", False)
JAX_DEVICE = jax.default_backend()
JAX_PRECISION = "x64" if jax.config.jax_enable_x64 else "x32"

if cuda_available:
    import cupy as cp

min_pow2 = 2
max_pow2 = 14
NF = [2**i for i in range(min_pow2, max_pow2)]
NREP = 5


def generate_freq_domain_signal(
    ND, f0=20.0, dt=0.0125, A=2
) -> FrequencySeries:
    """
    Generates a frequency domain signal.

    Parameters:
    ND (int): Number of data points.
    f0 (float): Frequency of the signal. Default is 20.0.
    dt (float): Time step. Default is 0.0125.
    A (float): Amplitude of the signal. Default is 2.

    Returns:
    FrequencySeries: The generated frequency domain signal.
    """
    ts = np.arange(0, ND) * dt
    y = A * np.sin(2 * np.pi * f0 * ts)
    yf = FrequencySeries(y, ts)
    return yf


def generate_func_args(ND: int, label="numpy") -> Tuple:
    Nf = Nt = int(np.sqrt(ND))
    yf = generate_freq_domain_signal(ND).data
    phif = phitilde_vec_norm(Nf, Nt, d=4.0)
    if "jax" in label:
        yf = jnp.array(yf)
        phif = jnp.array(phif)
    if "cupy" in label and cuda_available:
        yf = cp.array(yf)
        phif = cp.array(phif)
    return yf, Nf, Nt, phif


def collect_runtime(func, func_args) -> Tuple[float, float]:
    warm_time = 0
    for i in range(5):
        t0 = time.process_time()
        func(*func_args)  # Warm up run
        warm_time = time.process_time() - t0

    if warm_time < 0.001:
        number = 1000
    elif warm_time < 0.1:
        number = 10
    else:
        number = 1
    # see https://stackoverflow.com/questions/48258008/n-and-r-arguments-to-ipythons-timeit-magic/59543135#59543135

    times = timing_repeat(lambda: func(*func_args), number=number, repeat=NREP)
    return np.median(times), np.std(times)


def collect_runtimes(func, label, NF_values) -> np.ndarray:
    results = np.zeros((len(NF_values), 3))
    bar = tqdm(NF_values, desc="Running")
    for i, Nf in enumerate(bar):
        ND = Nf * Nf
        bar.set_postfix(ND=f"2**{int(np.log2(ND))}")
        func_args = generate_func_args(ND, label)
        try:
            _times = collect_runtime(func, func_args)
        except Exception as e:
            print(f"Error processing ND={ND}: {e}")
            _times = (np.nan, np.nan)
        results[i] = np.array([ND, *_times])

    runtimes = pd.DataFrame(results, columns=["ND", "median", "std"])
    runtimes.to_csv(f"runtime_{label}.csv", index=False)

    return runtimes


def save_jax_runtimes():
    from pywavelet.transforms.jax.forward.from_freq import (
        transform_wavelet_freq_helper as jax_transform,
    )

    jax_label = f"jax_{JAX_DEVICE}_{JAX_PRECISION}"
    collect_runtimes(jax_transform, jax_label, NF)


def save_cupy_runtimes():
    from pywavelet.transforms.cupy.forward.from_freq import (
        transform_wavelet_freq_helper as cp_transform,
    )

    collect_runtimes(cp_transform, "cupy", NF)


def save_numpy_runtimes():
    from pywavelet.transforms.numpy.forward.from_freq import (
        transform_wavelet_freq_helper as np_transform,
    )

    collect_runtimes(np_transform, "numpy", NF)


def cache_all_runtimes(cache_fn: str = "runtimes.json"):
    data = {}
    for f in glob.glob("runtime_*.csv"):
        df = pd.read_csv(f)
        label = f.split("runtime_")[1].split(".")[0]
        data[label] = df.to_dict(orient="records")

    # load any existing data
    if os.path.exists(cache_fn):
        with open(cache_fn, "r") as f:
            existing_data = json.load(f)
            data.update(existing_data)

    # save to json
    with open(cache_fn, "w") as f:
        json.dump(data, f, indent=4)

save_numpy_runtimes()
save_jax_runtimes()
cache_all_runtimes()
import matplotlib.pyplot as plt
import pandas as pd
import json
import numpy as np
from typing import Tuple


import matplotlib.pyplot as plt

# Set the desired RC parameters
rc_params = {
    "xtick.direction": "in",  # Mirrored ticks (in and out)
    "ytick.direction": "in",
    "xtick.top": True,  # Show ticks on the top spine
    "ytick.right": True,  # Show ticks on the right spine
    "xtick.major.size": 6,  # Length of major ticks
    "ytick.major.size": 6,
    "xtick.minor.size": 4,  # Length of minor ticks
    "ytick.minor.size": 4,
    "xtick.major.pad": 4,  # Padding between tick and label
    "ytick.major.pad": 4,
    "xtick.minor.pad": 4,
    "ytick.minor.pad": 4,
    "font.size": 14,  # Overall font size
    "axes.labelsize": 16,  # Font size of axis labels
    "axes.titlesize": 18,  # Font size of plot title
    "xtick.labelsize": 12,  # Font size of x-axis tick labels
    "ytick.labelsize": 12,  # Font size of y-axis tick labels
    "xtick.major.width": 2,  # Thickness of major ticks
    "ytick.major.width": 2,  # Thickness of major ticks
    "xtick.minor.width": 1,  # Thickness of minor ticks
    "ytick.minor.width": 1,  # Thickness of minor ticks
    "lines.linewidth": 3,  # Default linewidth for lines in plots
    "patch.linewidth": 4,  # Default linewidth for patches (e.g., rectangles, circles)
    "axes.linewidth": 2,  # Default linewidth for the axes spines
}

# Apply the RC parameters globally
plt.rcParams.update(rc_params)


JAX_LOGO = 'https://github.com/jax-ml/jax/blob/main/images/jax_logo.png'
NUMPY_LOGO = 'https://github.com/numpy/numpy/blob/main/branding/logo/primary/numpylogo.png'
CUPY_LOGO = 'https://github.com/cupy/cupy/blob/main/docs/image/cupy_logo_1000px.png'

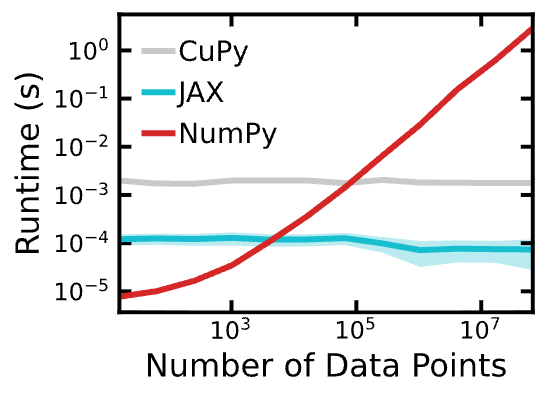
def plot_all_runtimes(cache_fn: str = "runtimes.json"):
    fig, ax = plt.subplots(figsize=(4, 3.5))

    with open(cache_fn, "r") as f:
        data = json.load(f)
        for label, runtimes in data.items():
            runtimes = pd.DataFrame(runtimes)
            _,_, line = plot(runtimes, ax=ax, label=label)
    ax.legend(frameon=False)
    return fig, ax


def plot(
    runtimes: pd.DataFrame, ax=None, **kwgs
) -> Tuple[plt.Figure, plt.Axes]:
    if ax is None:
        fig, ax = plt.subplots(figsize=(4, 3.5))
    fig = ax.figure

    runtimes = runtimes.dropna()
    runtimes = runtimes.sort_values(by="ND")

    nds = runtimes["ND"].values
    times, stds = runtimes["median"], runtimes["std"]
    line = ax.plot(nds, times, **kwgs)
    kwgs["label"] = None
    ax.fill_between(
        nds,
        np.array(times) - np.array(stds),
        np.array(times) + np.array(stds),
        alpha=0.3,
        **kwgs,
    )

    ax.set_yscale("log")
    ax.set_xscale("log")
    ax.set_xlabel("Number of Data Points")
    ax.set_ylabel("Runtime (s)")
    return fig, ax, line


fig, ax = plot_all_runtimes()
fig.savefig("runtimes.png", bbox_inches="tight")
!Runtime Comparisons